Every candle, every timeframe
5 minutes, 15 minutes, 30 minutes, 1 hour, 4 hours, 1 day and 1 week. Look at the candle forming right now or the last one that closed, aligned to the exchanges’ own UTC candles.
Live on Binance, Kraken and Coinbase
Other screeners show rolling 24-hour numbers. Coinlyzer screens every pair by the candles traders actually watch, from 5 minutes to a week, and updates every second.
Free account · No card needed
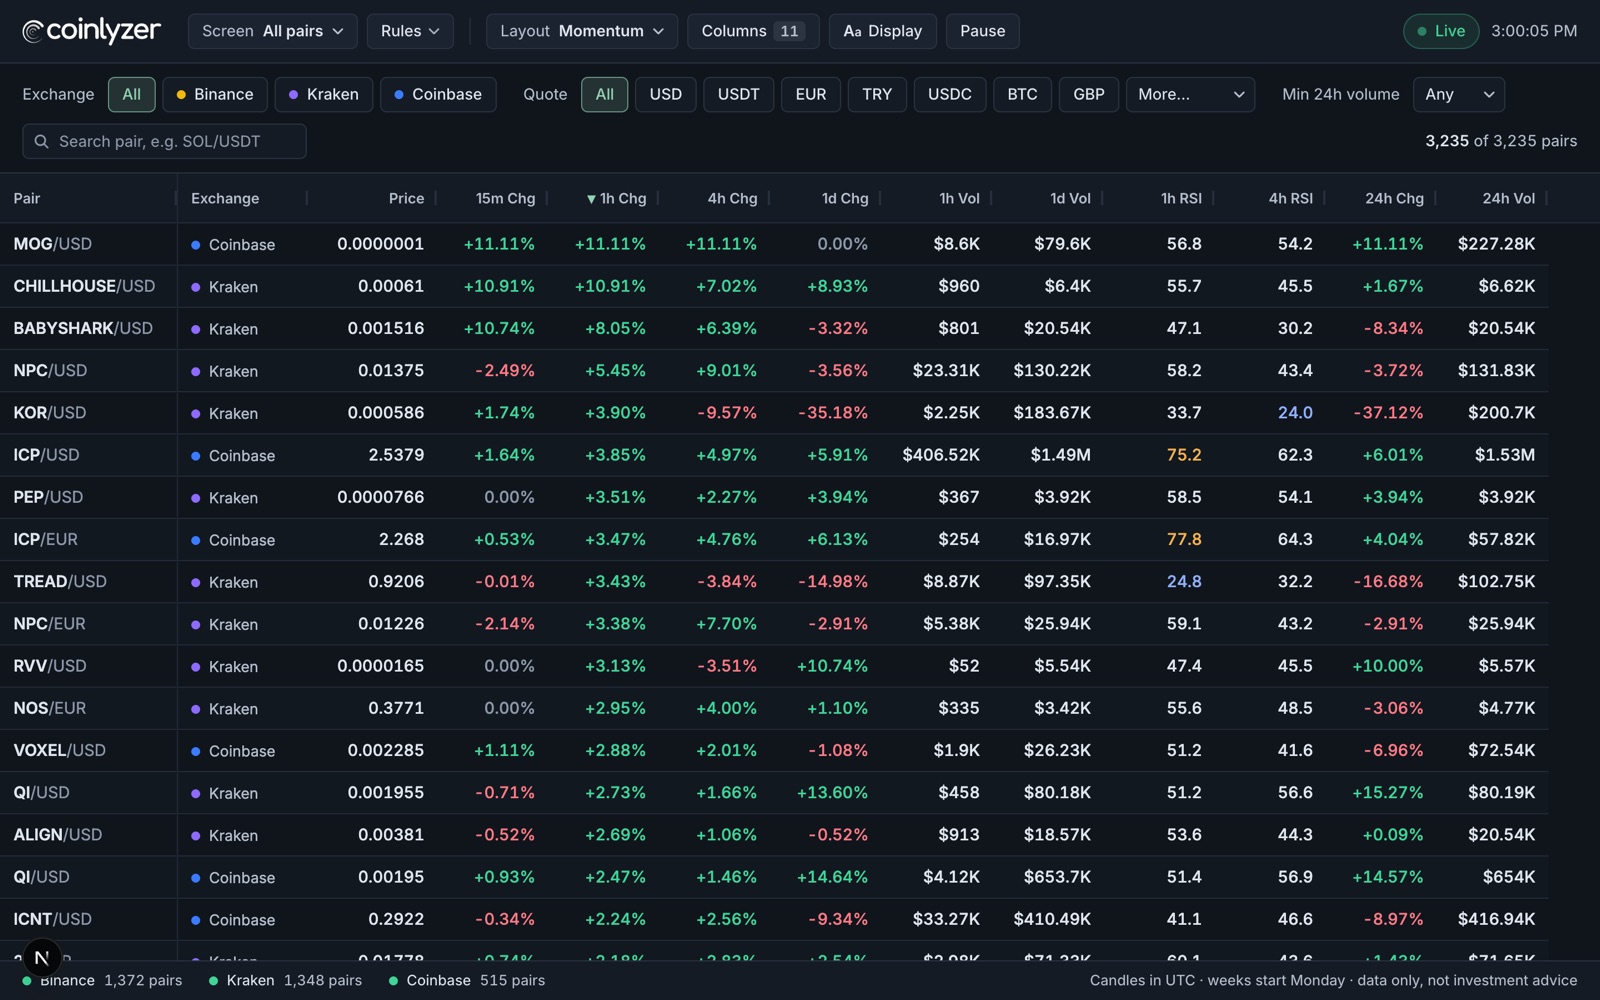
Find the pairs that matter right now: a daily candle breaking out, an hourly volume spike, three green hours in a row.
5 minutes, 15 minutes, 30 minutes, 1 hour, 4 hours, 1 day and 1 week. Look at the candle forming right now or the last one that closed, aligned to the exchanges’ own UTC candles.
“Binance USDT pairs with the 1-day candle up over 10% and the last 3 hourly candles up over 2%.” Combine rules with all or any; the match count updates as you type.
Binance, Kraken and Coinbase side by side, with volume converted to US dollars so pairs compare fairly, whatever they are quoted in.
Change over the last 2 to 24 candles, green and red streaks, volume against the 20-candle average, RSI 14, candle range, and rolling 24-hour numbers.
Values stream in as trades happen, and changed cells flash. Pause the table any time to read it, then pick up where the market is.
Save screens and column layouts to your account, sort by anything, pin and resize columns, and share a screen with a link.
Start from a ready-made screen, like hourly volume spikes, RSI oversold or a 4-hour breakout, or from all pairs.
Choose a measure, a timeframe and a threshold. Add as many rules as you need.
Pairs appear the moment they match and leave when they stop. Alerts are coming soon.

Create a free account and open the live screener in under a minute.
Create free account